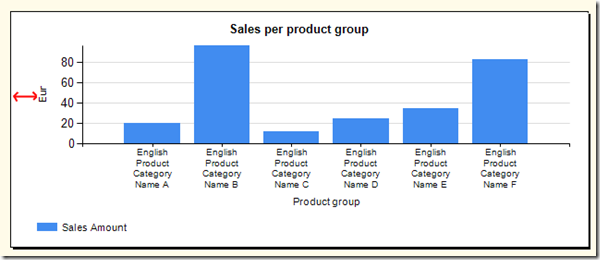
Sometimes you want the chart are to stretch all the way to the left edge of the report. Today I wanted that! It took some time for me to figure out how to do this and here is´the solution.
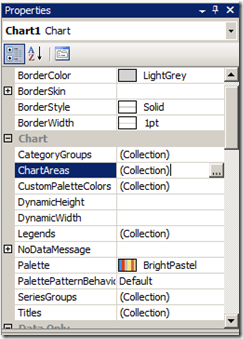
Select the Chart and in the Properties window click the ellipse button for the property ChartAreas.
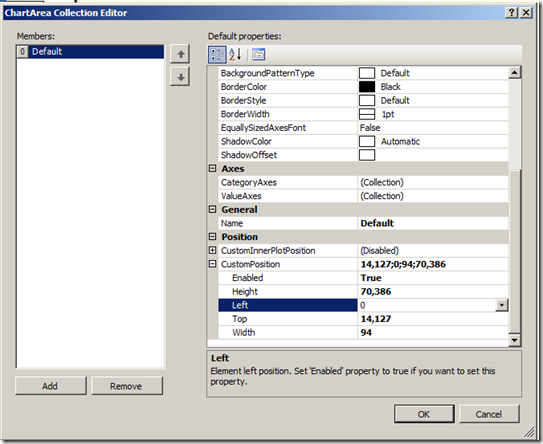
Expand the property CustomPosition and change Enabled to True and set the property Left to 0
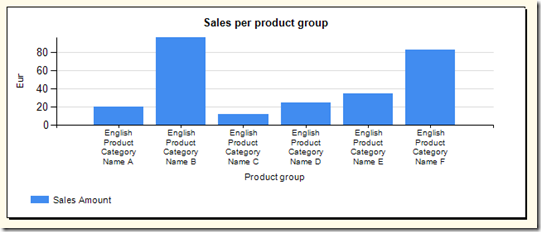
This will make the chart area move to the left of the chart as shown in the image below.
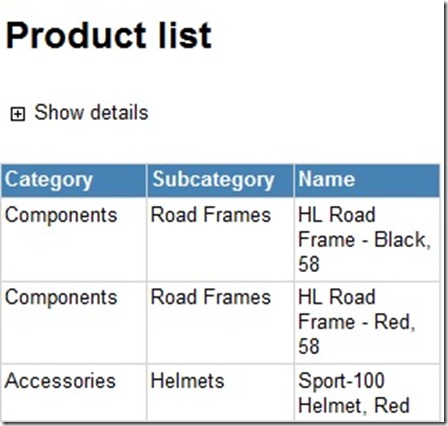
Sometimes it can be a good idea to show users an overall view of data. But sometimes this isn’t enough and the user wants to se more information, i.e. columns.
If you have a tablix with static columns and want to be able to show more columns when a user click “Show details” your first approach might be to select the column and set an expression of the hidden property as below.
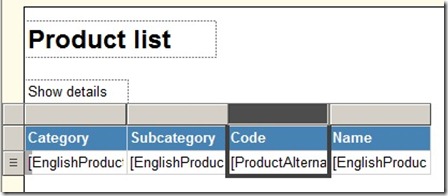
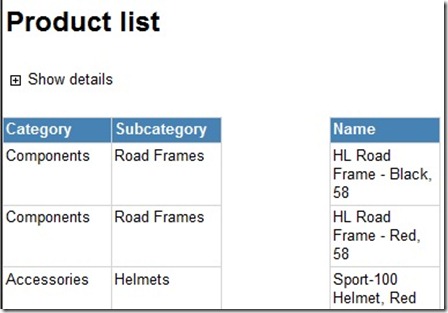
When you select a column like this it is the contents of the column that is selected (i.e. textboxes) and not the column itself. Therefor when you run the report the columns content will be hidden but not the column itself.
The solution
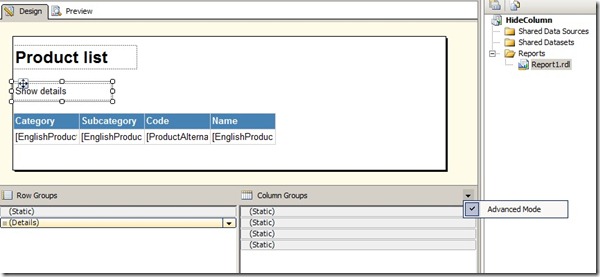
To hide the actual table column you must first put the Column Groups section on the design surface to advanced mode by first clicking the little triangle and then select Advanced mode as the picture below shows.
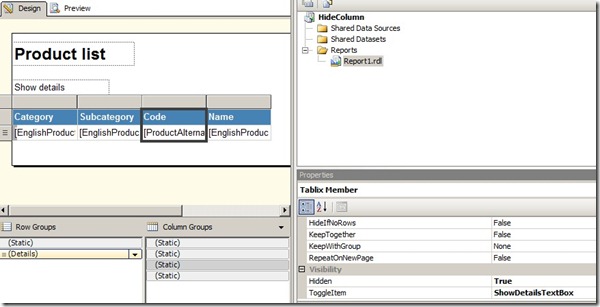
In the list select the column you want to hide and set the Hidden property to True and the ToggleItem to the item that should toggle visibility.
As a result the table will now “shrink” the entire table width and make the table look like we wanted it to.
To query a cube in T-Sql you will have to use OPENROWSET, or OPENQUERY. The query returns a “flattened rowset” and not a multi dimensional result set.
With OPENROWSET it looks like this.
SELECT a.*
FROM OpenRowset(‘MSOLAP.4′,’DATASOURCE=TESTDEV; Initial Catalog=Adventure Works DW 2008;’,
‘SELECT Measures.[Internet Sales Amount] ON COLUMNS,
[Product].[Category].members ON ROWS
FROM [Adventure Works]’) as a
If you want to use OPENQUERY you must first add a linked server and then use it in the query.
EXEC sp_addlinkedserver
@server=’OLAP_LINKED_SERVER’,
@srvproduct=”,
@provider=’MSOLAP’,@datasrc=’TESTDEV’,
@catalog=’Adventure Works DW 2008′go
— MDX in OPENQUERY —
SELECT * FROM OPENQUERY(OLAP_LINKED_SERVER,
‘SELECT Measures.[Internet Sales Amount] ON COLUMNS,
[Product].[Category].members ON ROWS
FROM [Adventure Works]’ )
If you want to use dynamic MDX you must execute the whole query (not just the OPENROWSET) as a string as described in this blog post
Let’s say you have a report getting its data from a SSAS cube. In the cube you have a date dimension.
Now. Imagine that you want a parameter pointing to the date dimension and the parameter cannot be a “select” parameter and it must be NON-QUERIED, i.e. the parameter is a free text field.
To make this work you first have to create a parameter, lets call it Year. The data type is set to “Text”, available values is set to “None” and Default values is set to “No default value”.
From here there are to alternatives:
- Build the parameter string manually.
- Send the string directly to the cube.
Solution 1
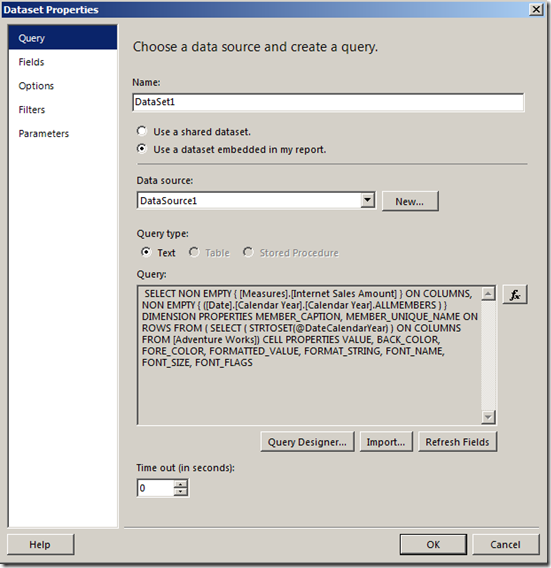
Build your dataset using the query designer. Drag the Year attribute to the filter pane in query designer. Check the box in Parameters column and you should see a query similar to this when you switch over to “Query mode”.
SELECT NON EMPTY { [Measures].[Internet Sales Amount] } ON COLUMNS, NON EMPTY { ([Date].[Calendar Year].[Calendar Year].ALLMEMBERS ) } DIMENSION PROPERTIES MEMBER_CAPTION, MEMBER_UNIQUE_NAME ON ROWS FROM ( SELECT ( STRTOSET(@DateCalendarYear, CONSTRAINED) ) ON COLUMNS FROM [Adventure Works]) CELL PROPERTIES VALUE, BACK_COLOR, FORE_COLOR, FORMATTED_VALUE, FORMAT_STRING, FONT_NAME, FONT_SIZE, FONT_FLAGS
To resolve the error “Could not create a list of fields…” with the detailed error “Query (1, 215) The restrictions imposed by the CONSTRAINED flag in the STRTOSET function were violated.” that occurs when you click Ok, you must edit the query string manually.
STRTOSET(@DateCalendarYear, CONSTRAINED) should be edited to STRTOSET(@DateCalendarYear).
When the query is done go to the Parameters tab. For the Parameter DateCalendarYear set the value to ="[Date].[Calendar Year].&[" & Parameters!Year.Value & "]".
This statement returns a string pointing to a member in the Calendar Year hierarchy in the date dimension.
Solution 2
This solution is more clean and a little bit simpler. I haven’t done any performance comparisons so I don’t know which one is the fastest.
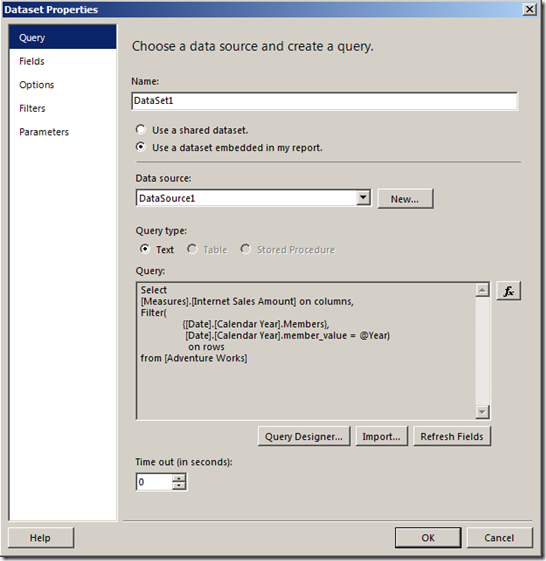
Create a new dataset using “Query Mode” and use the following query.
Select
[Measures].[Internet Sales Amount] on columns,
Filter(
{[Date].[Calendar Year].Members},
[Date].[Calendar Year].member_value = @Year)
on rows
from [Adventure Works]
This query fetches the correct Years with the MDX filter function, just returning the year corresponding to the parameter.
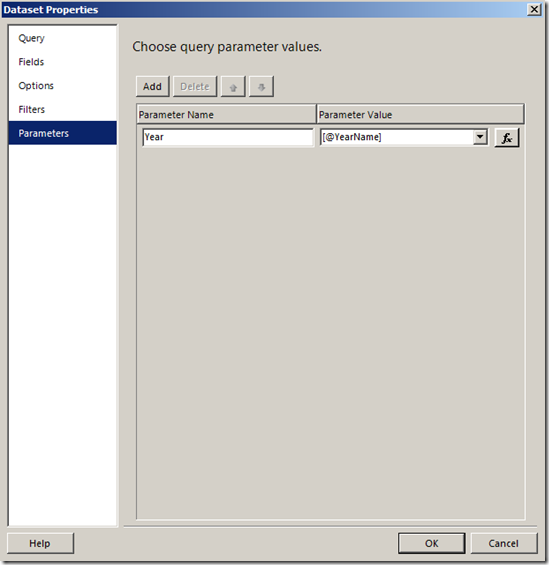
Go to the Parameters tab and for the parameter Year, select @Year, created earlier in this example.
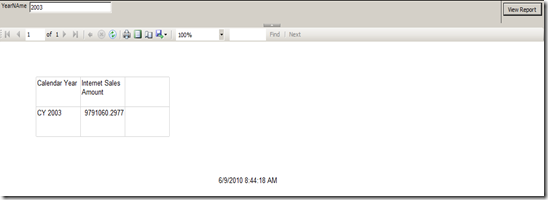
The final result look like this.
To get a description on a calculated measure you either install BIDS helper and follow this little guide http://bidshelper.codeplex.com or you do the following.
In the XML code for the cube find the tag <CalculationProperties>. Inside this tag it should look something like:
<CalculationProperty dwd:design-time-name="b85f38de-e526-4e67-89ba-8a399e0572b1">
<CalculationReference>[Measures].[MeasureName]</CalculationReference>
<CalculationType>Member</CalculationType>
<Translations>
<Translation dwd:design-time-name="a2d45a9d-8213-4d44-9db6-511a97efb363">
<Language>3082</Language>
<Caption>Porcentaje de Descuento</Caption>
</Translation>
</Translations>
<Description>Measure Description Here</Description>
</CalculationProperty>
If the measure isn’t there you will have to do some magic. Create a translation for the measure; this puts the measure in the XML then when you have made the XML to look like above you remove the translation again.
Calculated measures can sometimes freak out regarding decimals. For example, if you have a calculated measure from a division of two measures the formatting can be the format string you set on the calculation or it can be inherited from either the numerator or the denominator.
To solve this problem put the following code snippet somewhere under the create script of the calculation.
Scope
(
[Measures].[MeasureName]
);
Format_String(This) = "#,#.0000";
End Scope;
The model below is a schematic description of the refining process steps that source data pass through on its way to the end user. The name of the steps indicates their main purpose and responsibility of the components which are active in each step.
Source
To make it easier to read source data there has to be rules defining how and when data will be sent to the Data Warehouse. There also has to be rules about how the information itself should look, column names, formats etc. Those rules must be set based on the needs and requirements present.
A person responsible for the source system should also be selected and that person should see to that the rules are followed and that the developers get the information they need. To get the correct data delivered a source system analysis must be performed with a person having good knowledge about the source system.
My recommendation is to let the source system “deliver” data as opposed to letting the BI-system fetch data directly from the source system. I say this because the responsibility that the correct data is delivered should be on the source system owner. This also requires the source system to maintain the data extractions when changes in the source system occur.
ETL
To get a scalable and functional BI system there has to be an architecture supporting this. The solution I use consists of four different areas that in turn contain tables for storage of information for different information and purposes. I use the term areas because the implementation can look different depending on the platform you are on. The areas can for example be schemas or databases.
The picture below shows what it could look like.
Source
This is the area where data should be delivered. It could be delivered as a text file on the file system or in a table in a database. Data in this area is stored exactly as the source system delivers it and isn’t changed.
Stage
Stage area is a temporary storage area used by the ETL process. For data to enter the stage area it has to pass defined rules. The rules can be that a field can’t be null, that a value must be in a certain span or that a date should be in a certain month. If the row is approved it can enter the stage area. Otherwise the row will be rejected and put in an error table along with a date and an error message.
Data Warehouse (Storage)
The Data Warehouse must be built to be scalable and flexible. Data from different source systems will be brought together in this area into a common structure. Fact (transactions) shall be stored at lowest level and the source systems natural key should be stored in a column as a unique key. This way you get a link back to the source system if needed.
My recommendation is not to let users access this area but to create a data mart for that purpose.
Star (Access)
Data in this area is stored in a star schema with dimensions and fact tables to make a foundation for reports and OLAP cubes and to be easily understandable for end users.
Dimensions have a simple primary key whereas fact tables have a composite key including the dimension keys. Data in fact tables should be aggregated to the level needed.
Configuration
Mappings and translations should be saved in a separate database. Mappings can be that one product from one system must be mapped to a product from another system. A translation can be from one product “P01” to a more understandable name like “Bicycle”. The reason for this area not being part of another area is that configuration data shall be persistent and that end users might change data in this area (i.e. Mappings and translation might change over time).
Function
The function area refers to the task of enabling different types of interactions with information from the Data Warehouse. In this area there are a bunch of suppliers, standards and tools available. Generally you can say that OLAP and standard reports are typical tools used but AdHoc query, data mining, simulation and Geographic information system (GIS) can be part of the function area.
The second post in the series about successful BI projects is the most important. The gathered requirements are the foundation of the whole BI solution. If your gathering and analysis of the requirements is poorly executed the overall project will suffer from this leading to unpleased end-users and bigger cost due to necessary changes in the system.
There are many ways to gather requirements and I’m not saying that one is better than the other but the one I’m using, and have been using for a while, works and also involves the business in the process. The method I use consists of at least two workshops. The reason that there should be at least two is that there will always be unanswered questions at the end of the first session and the time between the first and the second workshops gives the participants some time for reflection and contemplation.
To make the most out of the workshops there has to be a couple of business roles present at the workshops: end-user, governance, business analyst and someone responsible for the source systems.
The output from the sessions should be a thorough requirements specification signed and approved by all parties including:
· Business area owner
· Measures
· Dimensions and their hierarchies
· Grade of detail regarding time
· User roles and how they will use data
· Non functional requirements (load frequency, availability, security etc)
· Presentation/end-user tools
One part of the deliverables is the information matrix below. The matrix maps dimensions against measures for specific questions/requirements (Q1) the business asks for.
|
Measures |
||||
|
Dimension |
Grain |
Measure 1 |
Measure 2 |
Measure 3 |
|
Dimension 1 |
Level 1 |
Q1 |
Q1 |
Q1 |
|
Level 2 |
Q1 |
Q1 |
Q1 |
|
|
Dimension 2 |
Level 1 |
Q1 |
Q1 |
Q1 |
|
Dimension 3 |
Level 1 |
Q1 |
Q1 |
Q1 |
|
Level 2 |
Q1 |
Q1 |
Q1 |
|
|
Level 3 |
Q1 |
Q1 |
Q1 |
This requirements specification doesn’t include technical implementation requirements or data specific demands. These requirements should be gathered in a so called source system analysis but this is another story and isn’t included in this post.
I’d like to start this series about successful BI projects with a little post about project ownership.
For a Business Intelligence project to be successful the business has to be involved. It is the business that owns the analysis area and therefore they also have the responsibility against the users. IT’s role is to understand the requirements and use available techniques to fulfill them.
The method for developing BI could be called “Agile” with frequent releases and changes (of requirements) in every version. The interesting part is that agile projects should be owned by the business, not by technical developers.
If the business owns the project, common problems like lack of vision, strategy and commitment will be reduced.
Conclusion: Let the business own the project and let IT do the development.
If you want to work with table data based on an external data connection in Excel Services, you can’t use an external data range (ordinary excel table). You must create a PivotTable and make it look like an ordinary table by flatten the hierarchies into a table.
Create a connection to a data source, get data and place it in a pivot table.
Place all your "columns" in Row Labels area.
Set the options so that the pivot table don’t show subtotals and grand totals.
Select the option to show the pivot table in Tabular Form. You’ll find it on the ribbon under PivotTable Tools tab and then Design tab.
To remove the +/- signs before each level click the Buttons button under Show/Hide group in PivotTable Tools, Options on the ribbon.
If you publish this to SharePoint using Excel Services to show it you can now filter, refresh and all the things you can do with a pivot table in Excel Services. With the look of an ordinary table.
